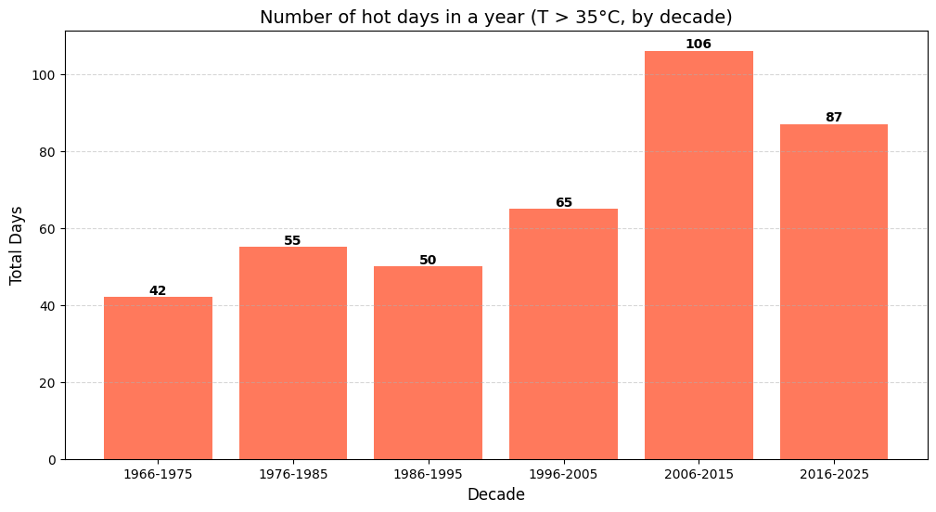
Mumbai's Rising Heat
The number of days per year exceeding 35°C in Mumbai has more than doubled over six decades.
Data, charts, and the science behind the crisis.
The number of days per year exceeding 35°C in Mumbai has more than doubled over six decades.
Global emissions continue to rise across all major sectors. Energy production remains the dominant source, but transport, industry, and agriculture all contribute significantly.
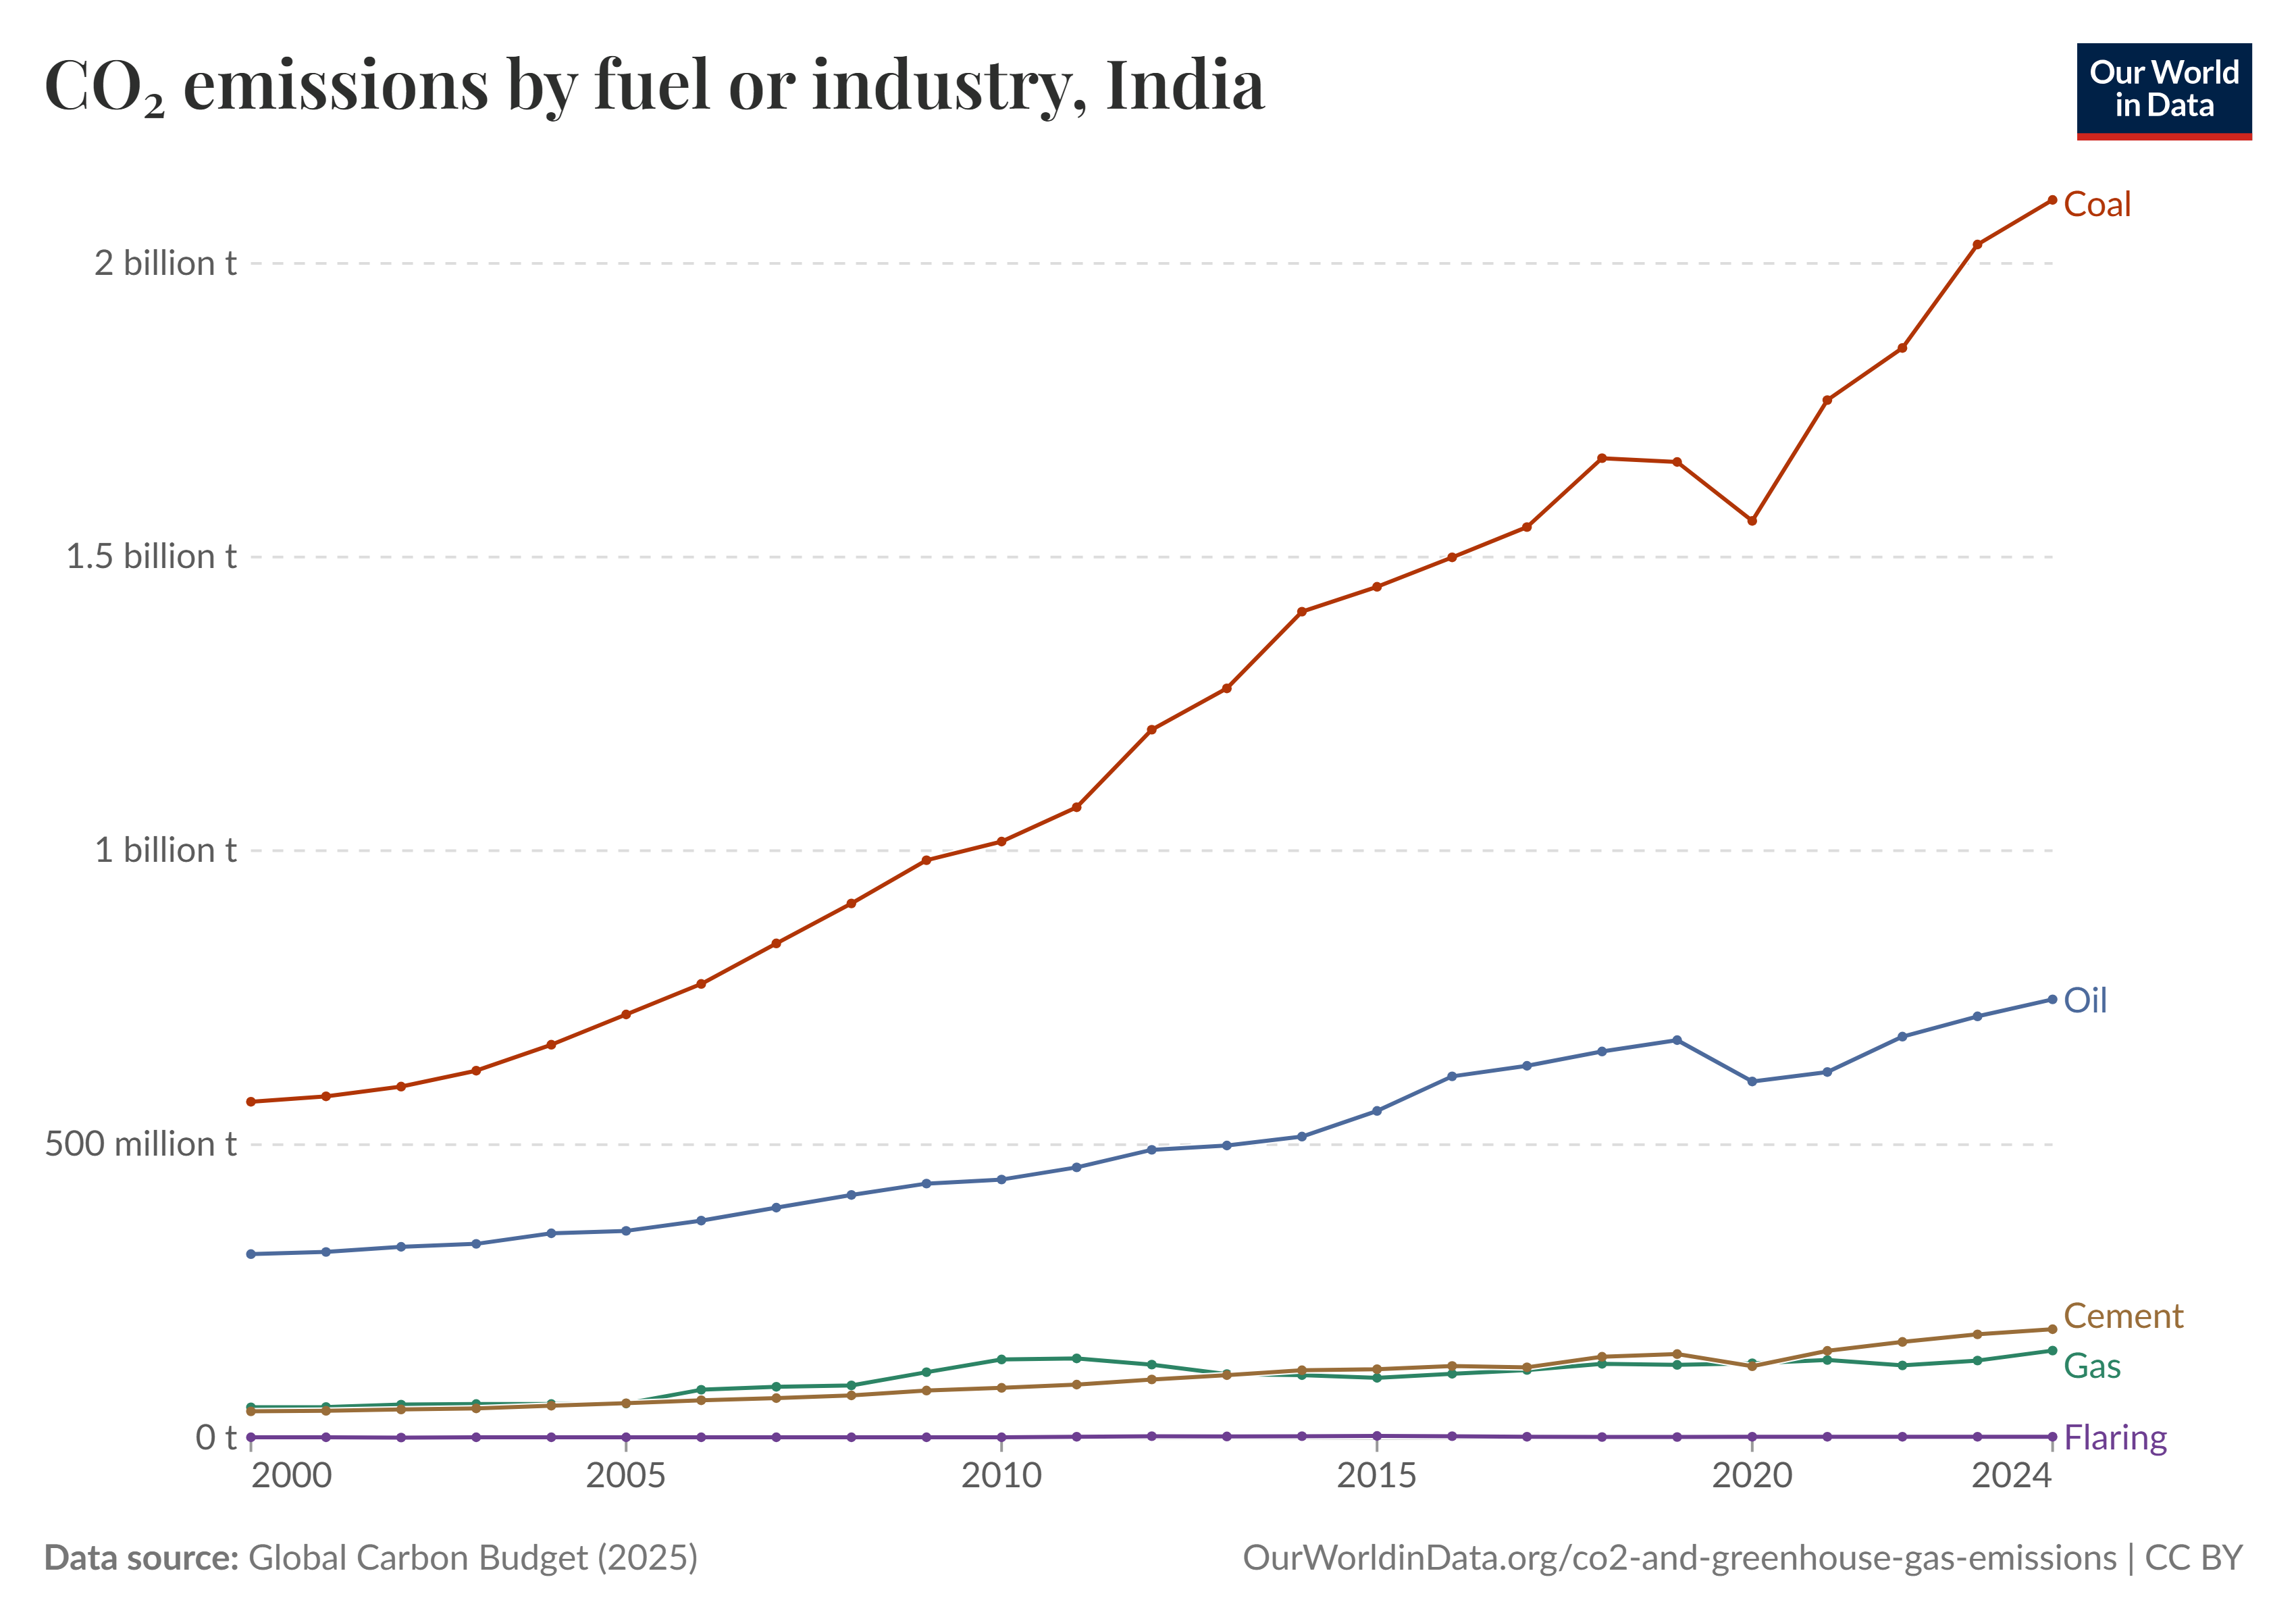
India's emissions have grown steadily since 2000. While per-capita emissions remain lower than many developed nations, the absolute numbers are rising fast — driven by industrialisation, urbanisation, and growing energy demand.
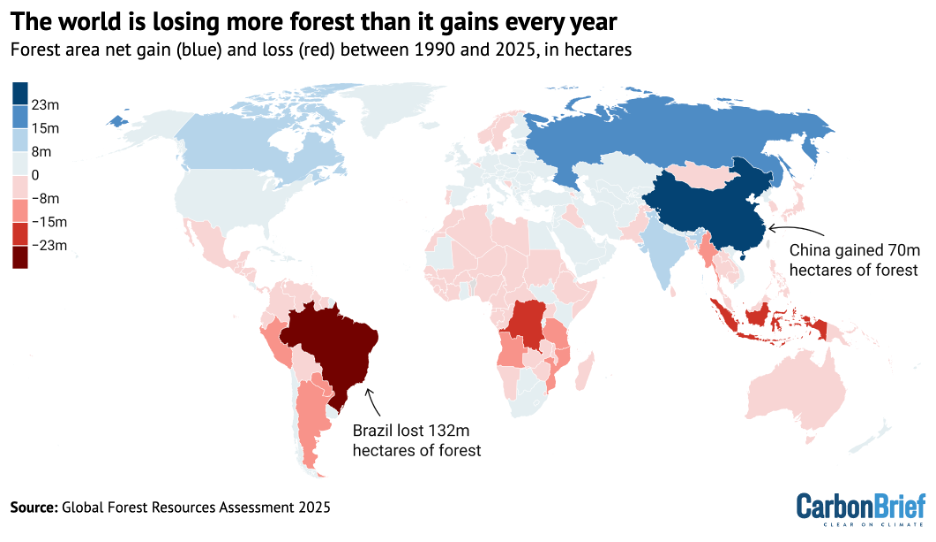
While global deforestation is declining overall, the rate of loss in critical tropical regions remains alarming. Forest gains in some areas are offset by devastating losses in others.
There's overwhelming evidence that the world has been warming since the late 19th century, when the burning of fossil fuels became widespread and resulted in large-scale emissions of heat-trapping carbon dioxide into the atmosphere.
This evidence comes from weather stations, buoys, ships, satellites and other sources. On average, surface temperatures are 1.2 degrees Celsius warmer than a century and a half ago. And the rate of warming has accelerated in recent decades.
Tide gauges show that sea levels have risen by about half an inch per decade since 1900. Satellites measuring gravitational changes show that billions of tons of ice have melted from the world's ice sheets and glaciers. Rainfall data shows that heavy downpours have increased because warmer air holds more moisture.
Scientists doing field research have documented effects on bird species — changing when they nest, breed and migrate, and even where they are able to live. Botanists see similar effects on crops, forests and other vegetation.
Over many decades, thousands of scientists have studied the warming planet. They've reached an overwhelming consensus: the burning of fossil fuels by humans is the primary cause of global warming today. Even scientists employed by oil companies have come to this conclusion.
One scientific study put it this way: the odds of current global warming occurring without human-caused greenhouse gas emissions are less than 1 in 100,000.
Scientists have looked at all the major forces affecting climate — the sun, ocean circulation patterns, volcanic activity, and greenhouse gases. The first three haven't varied enough in the last 150 years to account for today's rapidly rising temperatures. That's especially true in the second half of the 20th century, when solar output actually declined and volcanoes had a cooling effect.
From studying bubbles of ancient air trapped in ice, scientists know that before 1750, the concentration of carbon dioxide in the atmosphere was roughly 280 parts per million. That number is now above 420 parts per million. Carbon dioxide acts like a blanket in the atmosphere, trapping the sun's heat and warming the planet.
A climate "tipping point" refers to a threshold beyond which small changes to global temperatures can have big, irreversible effects.
For example, if the world isn't able to rein in global warming, the melting of the huge ice sheet that covers Greenland will eventually become self-sustaining and irreversible. If this threshold is crossed, the melting could raise sea levels by as much as 23 feet over the course of several centuries, swamping coastal cities around the world.
Some major tipping points are:
(1) The melting of the ice sheets in Antarctica and Greenland. The total effect of this, which could take two hundred years to unfold, would see the seas rise by about 23 feet above present levels. However the rise even in the next fifty years would be enough to flood the coastal areas of the world where our most dynamic and wealthiest cities are situated — London, New York, Mumbai, Shanghai, Singapore… to name a few.
(2) The thawing of the Arctic permafrost. This never-melted frost has kept buried for eons millions of tons of methane gas, which is eighty times as potent a greenhouse gas as carbon dioxide in the short term. Such a stupendous release in the atmosphere could set off a vicious cycle of atmospheric pollution.
(3) Gulf stream reversal. The melting of huge amounts of polar ice would mean that the large volumes of cold water moving south would mix with the heating ocean currents of the Gulf Stream warming Europe, nullify and maybe reverse it.
(4) The reversal of the Indian monsoon. Rising temperatures and winds may scatter the formation of rain clouds or concentrate them in new areas causing a drought in erstwhile fertile areas.
(5) The ice caps of the Himalaya mountains lose their permanent ice cover. This can endanger the regular regeneration of fresh water for major rivers like the Ganges and the Indus. The consequences for downstream populations would be dire.
(6) The Amazon rainforest, the biggest of its kind in the world, greatly influences the weather of the South American continent by the evaporation of water vapour above the masses of trees. As deforestation increases, once the number of trees falls below a certain critical number, the evaporation level will not be sufficient to sustain the trees still standing, setting off a downward vicious cycle. The rainforest would become a savannah and the continent may dry out.
Recent research suggests that some of these changes may start to occur once global warming reaches between 1.5 and 2 degrees Celsius above preindustrial average temperatures. And the world is already 1.2 degrees Celsius warmer than it was in the 19th century.
The 1.5°C barrier is expected to be breached within the next decade. That is all the time we realistically have.